
 EN
EN  FR
FR  RU
RU  ES
ES 

 Fast Delivery


 Get Machine Pricing
Cement drives material spending, although aggregate prices and freight distance can change its share. Labor costs respond to wage rates and plant utilization. Power expenses depend on the energy source and operating time. Maintenance costs rise with operating hours and product requirements, whereas finance costs reflect capital terms and working-capital needs.
Because each factor affects saleable output, a reliable calculation prices inputs before dividing total spending by approved blocks. Machine capacity can then change the result by improving labor efficiency and distributing equipment costs across production volume.
What Goes Into the Cost of One Block?
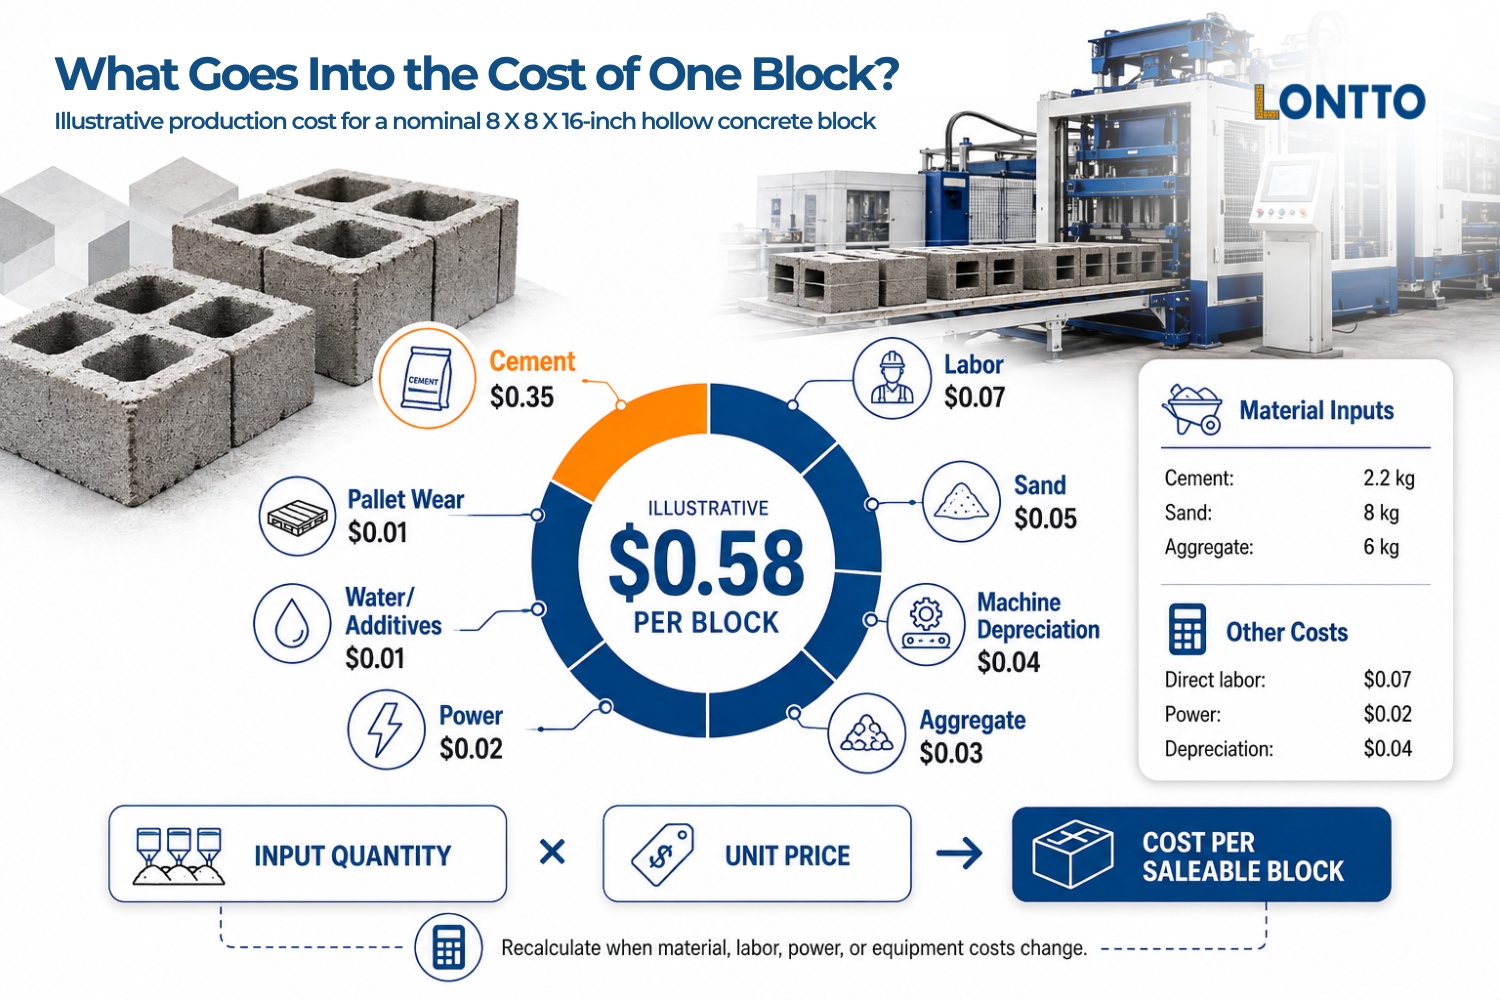
The cost to produce concrete blocks starts with the material quantity needed for one saleable unit. Labor and equipment costs complete the calculation. A nominal 8-by-8-by-16-inch hollow concrete masonry unit provides a consistent reference size for the models below.
Recalculate the cost to produce concrete blocks when input prices change.
U.S. load-bearing units must meet the applicable project specification. ASTM C90 requires load-bearing CMUs to meet a minimum net-area compressive strength of 2,000 psi.
Producers should confirm sampling and testing requirements against the applicable ASTM standards. Contract documents define project-specific requirements. Strength requirements affect cement content and material cost, so producers should confirm the required standard before pricing a mix.
Illustrative cost assumptions
The following low-cost-market model uses a stated quantity or allocated amount for every required input. The $0.58 total represents a semi-automatic pre-reject planning cost. A 2026 block production model uses 2.2 kilograms of cement per unit. The same model allocates 14 kilograms (30.86 lbs) to sand and aggregate combined.
| Cost input | Quantity or basis per block | Illustrative unit price | Cost per block |
|---|---|---|---|
| Cement | 2.2 kilograms (4.85 lbs) | $0.16 per kilogram ($0.073 per lb) | $0.35 |
| Sand | 8 kilograms (17.64 lbs) | $0.006 per kilogram ($0.0027 per lb) | $0.05 |
| Aggregate | 6 kilograms (13.23 lbs) | $0.005 per kilogram ($0.0023 per lb) | $0.03 |
| Water and additives | Allocated volume | Local rate | $0.01 |
| Pallet wear | Allocated use | Replacement cost per cycle | $0.01 |
| Direct labor | Allocated time | Local wage | $0.07 |
| Power | Metered use | Local tariff | $0.02 |
| Machine depreciation | Allocated output | Plant schedule | $0.04 |
| Illustrative total | $0.58 |
The concrete block production cost per unit changes as soon as one assumption moves. Separate sand and aggregate prices reveal how haul distance affects each material. Pallet wear deserves its own line because replacement cycles change with handling practices and machine pressure.
Batch records improve the quantity side of the table. Operators can weigh cement and aggregate before mixing, then record approved blocks after curing. Dividing each consumed quantity by approved output produces a measured input rate per block. Supplier invoices provide the matching delivered unit price.
Depreciation needs a consistent schedule. A units-of-production method subtracts expected residual value from landed machine cost and then divides the balance by expected lifetime saleable output. Producers can review the allocation each year as machine hours and saleable volume develop.
The Formula You Can Use With Local Prices
A block making cost calculation works best when every value comes from the same production period. Matching monthly payroll with monthly output yields consistent results. Use one reporting window for costs and saleable units. Each block-making cost calculation should use a consistent reporting period.
- Cost per saleable block = Total production costs during the period ÷ Saleable blocks produced during the period
Total production costs include consumed materials and direct labor. The total should cover energy and equipment depreciation as well. Pallet wear and repairs belong in the same reporting period. Quality-control expenses complete the production total.
Using actual production records
Plant records provide the strongest cost result because actual spending captures every consumed input. The denominator should include blocks released for sale after curing and inspection. Handling records keeps all production spending in the numerator, so the formula assigns each cost across approved output.
For example, a plant spends $14,500 during one month and releases 25,000 saleable blocks. The calculation produces a cost of $0.58 per block. The period formula captures every consumed resource once.
Consistent reporting periods make month-to-month comparisons useful. A producer can compare the new unit cost with the prior period, then trace any change to material consumption or operating expense. Recorded causes support purchasing decisions and process adjustments.
Need to Produce Blocks at Scale?
Our block making machines are built for commercial and industrial production. Get expert advice and a custom price quote — we respond within 24 hours.
Estimating costs before production
A planning model can apply one allowance before actual records exist:
- Forecast cost per saleable block = Theoretical cost per produced block ÷ (1 − Reject rate)
Calculate reject rate by dividing rejected units by total units produced. Forecast cost per saleable block then equals theoretical cost per produced block divided by 1 − reject rate.
- $0.55 ÷ 0.95 = $0.579, or $0.58 per saleable block
Trial runs replace the planning percentage with measured cost and approved output.
The planning allowance should reflect the proposed process and operator experience. A new mold may produce a different approval rate than an established product. Recording trial batches by mold creates a stronger forecast for regular production.
Cost per Block by Machine Type
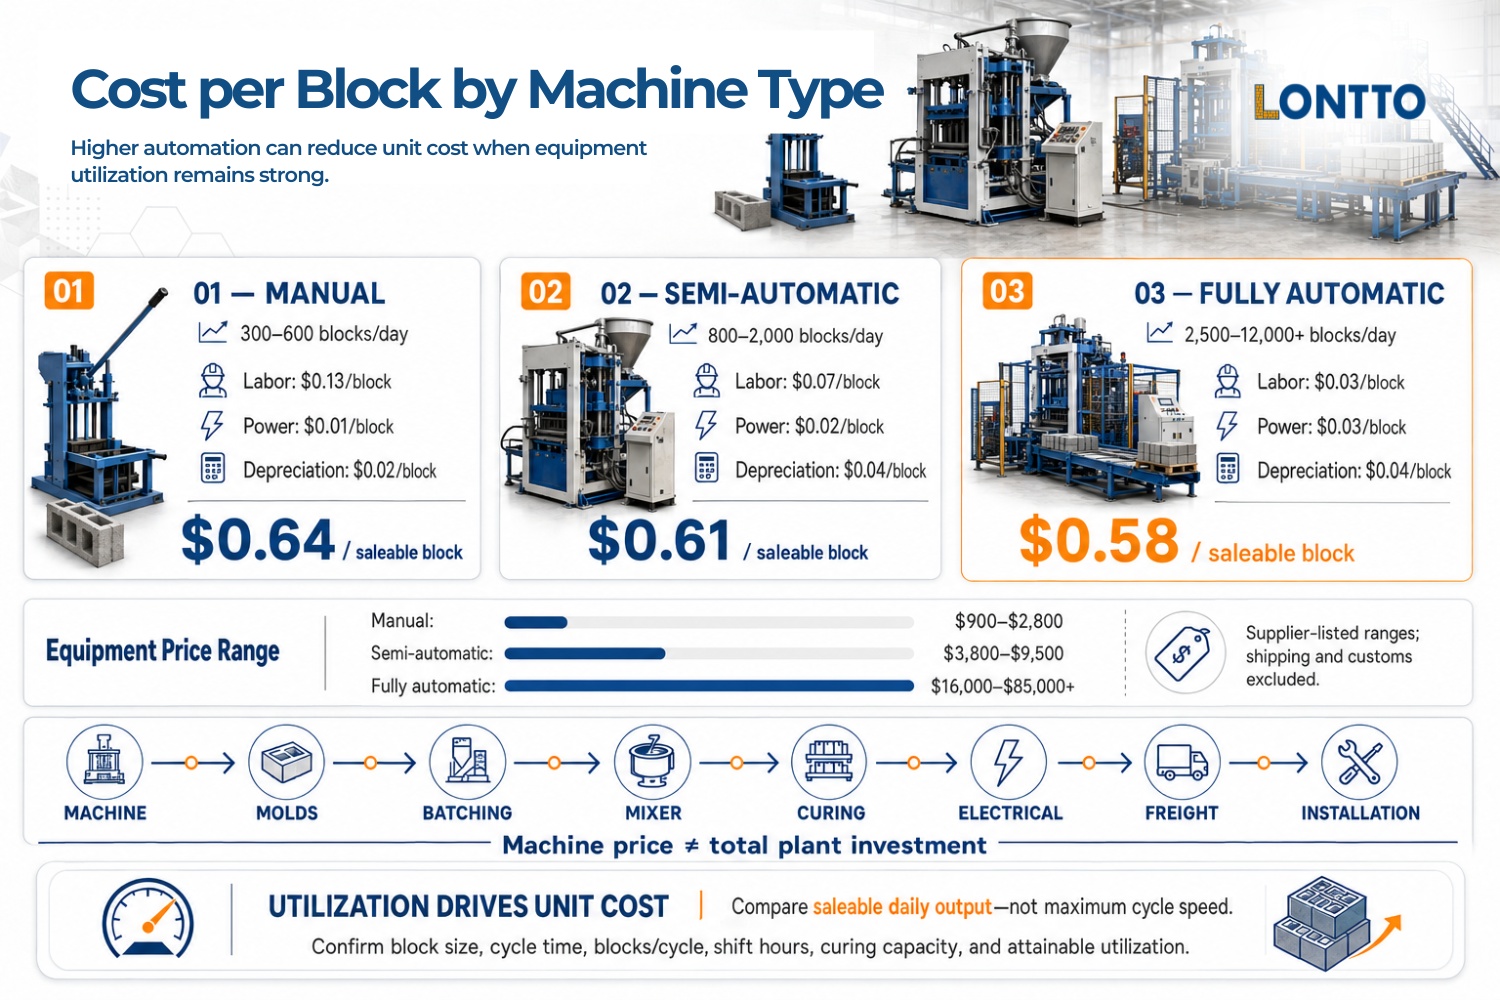
The cost of making concrete blocks changes with labor allocation and equipment use. Manual production assigns more worker time to each unit. Automated lines distribute capital costs across higher output when confirmed demand keeps the equipment productive.
Supplier-published price and capacity ranges provide an initial screening reference rather than a universal equipment benchmark. Written quotations should verify the exact machine and mold. Each quote should state block size and shift pattern. Auxiliary equipment should appear on a separate line.
Manual machines range from $900-$2,800 and produce 300-600 blocks daily. Semi-automatic machines range from $3,800-$9,500 and produce 800-2,000 blocks daily. Fully automatic models cover mobile and stationary configurations. Supplier-listed prices span $16,000-$85,000 or more before shipping and customs.
The table below holds material assumptions constant, then changes labor and machine allocations. Each result includes a 5% planning allowance. Local records should replace every modeled value.
| Machine type | Daily output | Labor per block | Power per block | Depreciation per block | Pre-reject cost | Cost per saleable block |
|---|---|---|---|---|---|---|
| Manual | 300-600 | $0.13 | $0.01 | $0.02 | $0.61 | $0.64 |
| Semi-automatic | 800-2,000 | $0.07 | $0.02 | $0.04 | $0.58 | $0.61 |
| Fully automatic | 2,500-12,000+ | $0.03 | $0.03 | $0.04 | $0.55 | $0.58 |
Machine purchase price is not the total plant investment. Budget separately for molds and batching equipment. Include mixers and pallets. Add conveyors or forklifts. Provide curing capacity and electrical works. Account for foundation and installation. Include freight and duties. Budget for commissioning and spares. Add site costs and inventory. Working capital completes the investment boundary.
Higher throughput supports lower labor allocation when machine utilization remains strong. A fully automatic line reaches the modeled unit cost when orders and curing capacity support its output. Semi-automatic equipment may provide better capital efficiency for a producer building a customer base.
Higher utilization can lower the cost of making concrete blocks. Machine quotations should identify output for the selected block size. Mold cycle time and blocks per cycle determine rated capacity. The operating plan should then apply expected shift hours and an attainable utilization rate. Saleable daily output provides a stronger comparison than maximum cycle speed.
Power requirements deserve the same model-specific treatment. Mixer motors and hydraulic systems contribute to total consumption beyond the forming machine. Generator fuel can replace grid electricity in the formula when local supply favors on-site generation.
Profit per Block at Retail
Profit per block equals the achieved selling price minus the selected cost measure. A contribution-margin calculation subtracts variable production costs. A gross-profit calculation subtracts the producer’s defined cost of goods sold. Net profit then accounts for operating expenses and financing.
The worked example uses an illustrative selling price of $0.85. A published low-cost-market model uses a $0.85 selling price. The fully automatic model produces a $0.27 production-level gross profit after its 5% reject allowance.
| Machine type | Illustrative selling price | Cost per saleable block | Gross profit per block | Gross margin |
|---|---|---|---|---|
| Manual | $0.85 | $0.64 | $0.21 | 25% |
| Semi-automatic | $0.85 | $0.61 | $0.24 | 28% |
| Fully automatic | $0.85 | $0.58 | $0.27 | 32% |
The cost figures already include the 5% planning allowance, so the profit calculation captures every modeled input once. Producers should replace $0.85 with the net amount received after discounts and customer credit terms. Delivery costs belong in the calculation whenever the producer pays for transport.
Price realization can differ from the listed rate. Volume discounts reduce revenue per unit, and payment terms add financing exposure. Using the amount collected per block creates a more practical profit estimate than using an advertised price.
Sales volume matters alongside margin. A $0.27 gross profit produces $270 across 1,000 saleable units. The same margin produces $2,700 across 10,000 units, provided confirmed demand absorbs the full output.
Overhead should remain visible outside the gross-profit table. Rent and administrative payroll convert a gross profit into operating profit. Interest and tax treatment then shape the final net result. Separating each measure helps producers compare operations on the same basis.
When Does the Machine Pay for Itself?
This illustration estimates how long cumulative production-level gross profit would take to equal the selected machine price.
- Gross-profit recovery months = Supplier-listed machine price ÷ Monthly production-level gross profit
- Monthly production-level gross profit = Gross profit per saleable block × Saleable blocks per day × Operating days per month
The following model uses supplier-listed machine price tiers and the gross profit figures above. Each month contains 26 operating days. Output begins at the lower end of each published range. The upper output case uses the higher end. Calculated periods represent full-sales planning scenarios.
| Machine type | Supplier-listed machine price | Modeled output | Production-level gross profit per block | Theoretical gross-profit recovery range |
|---|---|---|---|---|
| Manual | $900-$2,800 | 300-600 daily | $0.21 | 0.3-1.7 months |
| Semi-automatic | $3,800-$9,500 | 800-2,000 daily | $0.24 | 0.3-1.9 months |
| Fully automatic | $16,000-$85,000+ | 2,500-12,000+ daily | $0.27 | 0.2-4.8+ months |
Actual recovery can take materially longer than the full-sales illustration. Ramp-up and downtime extend the period. Utilization and financing change the result. Working capital and delivery costs increase invested funds. Demand variability affects monthly sales. Verified sales demand provides the strongest basis for selecting a tier.
Sensitivity testing shows how quickly the recovery period changes. Producers can run the formula at 50% and 70% utilization. A 90% case can represent stronger performance. A second calculation can apply a higher cement price. The resulting range gives buyers a stronger capital plan across several operating conditions.
U.S. vs. Emerging-Market Cost Pictures
Regional examples are easier to compare when they use the same block size, density class, strength target, mix design, cost boundary, and costing method. Local quotations refine the concrete block production cost per unit.
U.S. planning cost model
The 2025 U.S. average cement mill value reached about $160 per metric ton, equal to $0.16 per kilogram before delivery. The model uses $0.22 per kilogram ($0.10 per lb) as an illustrative delivered plant price. Local supplier quotes should replace the $0.06 delivery allowance.
| U.S. planning input | Illustrative calculation | Cost per block |
|---|---|---|
| Cement | 2.2 kilograms × $0.22 | $0.48 |
| Sand | 8 kilograms × $0.020 | $0.16 |
| Aggregate | 6 kilograms × $0.025 | $0.15 |
| Water and additives | Allocated | $0.01 |
| Pallet wear | Allocated | $0.02 |
| Direct labor | Semi-automatic allocation | $0.30 |
| Power | Metered allocation | $0.05 |
| Machine depreciation | Output allocation | $0.08 |
| Subtotal | $1.25 | |
| Cost with 5% contingency | $1.25 × 1.05 | $1.31 |
The U.S. model uses semi-automatic labor allocation and an illustrative delivered cement premium. Freight distance can raise the sand and aggregate lines. Local wage rates can move labor costs by a similar amount. Current quotations provide the values needed for an investment decision.
Emerging-market cost model
The emerging-market example uses the fully automatic model’s $0.55 pre-reject cost. Dividing $0.55 by 0.95 produces a cost of approximately $0.58 per saleable block after a 5% reject allowance.
| Regional comparison | Base cost | Adjusted modeled cost | Illustrative selling price for $0.27 production-level gross profit |
|---|---|---|---|
| U.S. illustration | $1.25 | $1.31 | $1.58 |
| Emerging-market illustration | $0.55 | $0.58 | $0.85 |
The $1.58 figure is not a full-business breakeven price. Excluded expenses include delivery and rent. Administration and insurance remain outside the model. Sales costs and finance costs require separate lines. Taxes and unsold inventory complete the full-business calculation.
Exchange rates and fuel prices can change the comparison quickly. Local payroll records refine labor allocation, and meter readings establish power cost. Producers can refresh the model quarterly or whenever a major input price changes.
Currency conversion should use the same date for every imported component. Domestic expenses can remain in local currency, then converted at the reporting stage. A consistent exchange rate keeps the regional comparison transparent.
After calculating your target output and production budget, Lontto can help identify a machine tier suited to your operating plan. U.S. buyers can compare models in the block making machine in the USA range. Producers elsewhere can review concrete block making machine options based on capacity and automation level.
For accurate pricing, send Lontto your block type and available power alongside your project location and required daily output. A sales representative will respond within 24 hours on working days.
FAQs on How Much Does it Cost to Make A Concrete Block?
What mix ratio should you use for concrete blocks?
The appropriate mix ratio depends on the required strength and local materials. A trial ratio provides a starting point, followed by controlled production testing. Aggregate grading and moisture control affect compaction. Curing practice then supports the specified performance.
Are hollow concrete blocks cheaper to produce?
Hollow blocks can require less concrete than solid units with the same external dimensions. Internal cores reduce material volume and finished weight. Mix design and strength requirements still control the final comparison. Readers can review hollow block sizes and product characteristics before selecting a production model.
What hidden costs affect block production?
Hidden costs include mold refurbishment and spare parts. Producers should budget for pallet replacement and quality testing as separate lines. Storage and delivery affect the final cost after curing. Working capital covers raw materials during the production-to-payment cycle.
Installation planning may include electrical upgrades and operator training. Freight and customs charges belong in landed machine cost. Tracking each expense against machine hours and saleable units creates a clearer operating record.
How does production scale affect cost per block?
Higher output spreads depreciation across more saleable units. Automation can improve labor efficiency when the plant maintains steady utilization. Curing space and material supply must expand with machine capacity. Confirmed orders help producers choose a scale that keeps output productive.
Back to Top : How Much Does it Cost to Make a Concrete Block? 2026 Full Breakdown

Speak To Our Brick Machine Expert
Get in touch with our nice team today to get a price estimate for a block machine.

I am Chao Zhang, I have been working in the brick making industry for over 10 years. I have a deep understanding and research on various models of block making machines, especially automatic brick machines, concrete block machines, compressed earth block machines, clay brick machines, cement brick machines. I have a special understanding of this industry. I can help my clients choose the suitable brick machine and assist them in designing and building a brick production factory. If you want to know everything about brick making machines, please contact me. I am happy to help you.
 Price Quote
 Call Us